
Analytics, Industry, Lithuania, Markets and Companies
International Internet Magazine. Baltic States news & analytics
Saturday, 15.02.2025, 22:01
Prices for total industrial production sold in Lithuania decreased by 2.0 % in July
 Print version
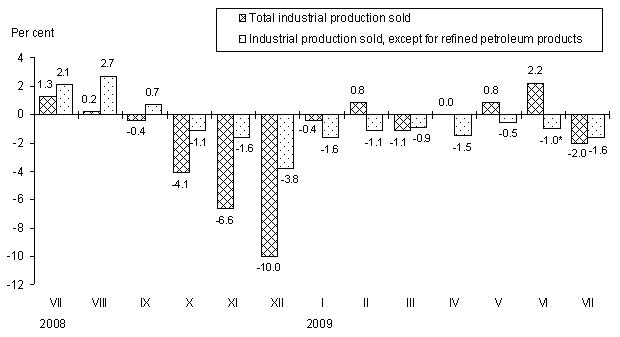 |
| Figure 1. Changes in prices for industrial production sold over a month |
* Revised data.
In July 2009, against June, the overall price change was mostly influenced by a 3.5 % price drop for refined petroleum products, 4.8 % – chemicals and chemical products, 4.5 % –electricity, as well as by a 4.1 % price rise for waste collection, treatment and disposal, materials recovery production, 0.7 % – rubber and plastic products, 0.1 % – food products, 0.4 % – furniture.
Prices for products sold on the domestic market over a month decreased by 2.0 %. It was mostly influenced by a 4.7 % price drop for electricity, 4.0 % – refined petroleum products, 6.3 % – metallic products, except for machinery and equipment, as well as by a 1.5 % price rise for rubber and plastic products, 2.7 % – textiles, 0.9 % – publishing, printing and reproduction of recorded media. Food products went down in price by 0.5 %. Among food products, the most noticeable price drop was recorded for processed fruit and vegetables – 5.5 %, condiments and seasoning – 3.2 %, meat – 2.5 %; while poultry went up in price by 5.2 %, ice-cream – 3.2 %, grain mill products – 2.1 %. Refined petroleum products excluded, prices for products sold on the domestic market decreased by 1.8 %.
Prices for exported products in July 2009, against June, decreased by 1.9 %. It was mostly influenced by a 3.3 % price drop for refined petroleum products, 6.3 % – chemicals and chemical products, 4.0 % – textiles, as well as by an 8.6 % price rise for waste collection, treatment and disposal, materials recovery production, 1.1 % – food products, 0.5 % – furniture. Refined petroleum products industry excluded, prices of exported products decreased by 1.2 %.
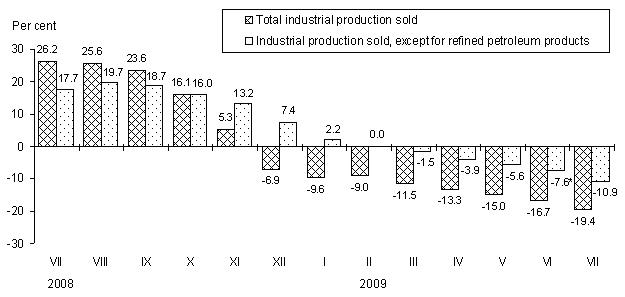
Over a year (July 2009, against July 2008), prices for total industrial production sold decreased by 19.4 %.
 |
|
Figure 2. Changes in prices for industrial production sold, against the respective month of the previous year |
* Revised data.
Changes in prices for industrial production sold, July 2009, %
|
Industrial production sold by economic activity |
Relative share in industrial production |
July 2009 against | ||
|
June 2009 |
2008 | |||
|
December |
July | |||
|
Total industrial production |
100.0 |
-2.0 |
0.3 |
-19.4 |
|
Mining and quarrying |
1.1 |
-3.5 |
10.1 |
-27.5 |
|
Manufacturing |
81.1 |
-1.8 |
1.6 |
-22.9 |
|
Manufacture of refined petroleum products |
15.6 |
-3.5 |
44.6 |
-40.4 |
|
Electricity, gas, steam and air conditioning supply |
16.1 |
-3.5 |
-7.8 |
2.4 |
|
Water supply; sewerage, waste management and remediation activities |
1.7 |
3.4 |
7.3 |
1.1 |
|
|
|
|
|
|
|
Total industrial production, refined petroleum products excluded |
84.4 |
-1.6 |
-7.9 |
-10.9 |
|
Manufacturing production, refined petroleum products excluded |
65.5 |
-1.2 |
-8.6 |
-13.8 |
|
|
|
|
|
|
|
Industrial production sold on the domestic market |
100.0 |
-2.0 |
-4.5 |
-9.7 |
|
Mining and quarrying |
1.3 |
-1.6 |
3.6 |
-12.7 |
|
Manufacturing |
67.2 |
-1.4 |
-3.2 |
-14.5 |
|
Manufacture of refined petroleum products |
8.2 |
-4.0 |
20.5 |
-38.1 |
|
Electricity, gas, steam and air conditioning supply |
30.1 |
-3.6 |
-8.0 |
2.4 |
|
Water supply, sewerage, waste management and remediation activities |
1.4 |
-3.0 |
0.2 |
3.2 |
|
|
|
|
|
|
|
Industrial production sold on the domestic market, refined petroleum products excluded |
91.8 |
-1.8 |
-6.7 |
-4.8 |
|
Manufacturing production, refined petroleum products excluded |
59.0 |
-0.9 |
-6.5 |
-8.2 |
|
|
|
|
|
|
|
Exported industrial production |
100.0 |
-1.9 |
5.6 |
-28.2 |
|
Mining and quarrying |
0.8 |
-6.4 |
22.6 |
-41.6 |
|
Manufacturing |
96.5 |
-2.1 |
5.3 |
-28.5 |
|
Manufacture of refined petroleum products |
23.6 |
-3.3 |
53.9 |
-41.4 |
|
Electricity, gas, steam and air conditioning supply |
0.8 |
0.0 |
0.0 |
0.0 |
|
Water supply; sewerage, waste management and remediation activities |
1.9 |
8.6 |
13.3 |
-1.1 |
|
|
|
|
|
|
|
Exported industrial production, refined petroleum products excluded |
76.4 |
-1.2 |
-9.4 |
-18.6 |
|
Manufacturing production, refined petroleum products excluded |
72.9 |
-1.4 |
-10.4 |
-18.7 |


 «The Baltic Course» Is Sold and Stays in Business!