
Analytics, Baltic, Employment, Lithuania
International Internet Magazine. Baltic States news & analytics
Tuesday, 29.04.2025, 05:58
Unemployment rate in Lithuania stood at 13.8% in Q3
 Print version
A rapid growth has been observed in the youth (aged 15–24) unemployment rate. In III quarter 2009, 53 thousand young people, or each tenth young person, were unemployed (a year ago, 26 thousand, i.e. twice less).
The youth unemployment rate in III quarter 2009 reached 33.3%. Over a quarter, the youth unemployment rate grew by 3.7 percentage points, a year ago – 2.2 times. The lowest youth unemployment rate (6.9%) was recorded in II quarter 2007.
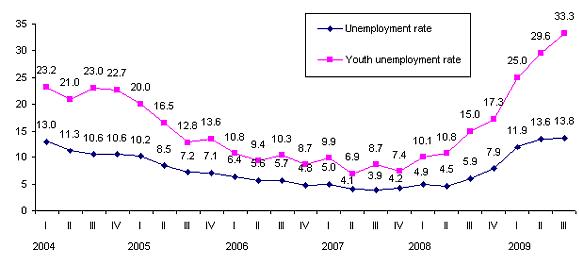 |
| Unemployment rate, 2004–2009, % |
Although the number of young unemployed persons a year ago, as compared with III quarter 2009, was twice as low (26 thousand), the number of young unemployed persons with higher education remained almost unchanged (7.4 and 7.8 thousand respectively). In I quarter 2009, the number of such unemployed made 2.8 thousand. In III quarter 2009, each fifth young person with higher, each seventh young person with secondary and each nineteenth young person with basic education was unemployed.
The male unemployment rate has been growing faster than the female one. The male unemployment rate grew from 6% in III quarter 2008 to 17.3% in III quarter 2009 (2.9 times), while the female one – from 5.9 to 10.3% (1.7 times). In II quarter 2009, the male unemployment rate stood at 16.7, the female one – at 10.4%. A higher male unemployment rate was conditioned by a rapid decrease in the amount of work in industrial and construction enterprises and a subsequent decrease in the number of people working in such enterprises.
In III quarter 2009, there were 1 million 424 thousand persons aged 15 and over working in the country; as compared with II quarter 2009, this figure remained almost unchanged (grew by 1.9 thousand, or 0.1%), while over a year it dropped by 113.4 thousand, or 7.4%.
Over III quarter 2009, the number of persons working in agriculture, forestry and fishing grew by 7.1 thousand, trade – by 9 thousand, professional, scientific and technical activities – by 6.7 thousand. The number of persons working in other economic activities remained almost unchanged.
The most marked decrease over a year was observed in the number of persons working in construction – from 167 to 117 thousand (by 30%), accommodation and food service activities – from 43 to 36 thousand (16%), manufacturing – from 262 to 223 thousand (15%).
In III quarter 2009, an increase was observed in the number of employees working not under an employment contract (fixed- or non-term), but under a verbal agreement. According to the estimates of Statistics Lithuania, in III quarter 2009, the number of such workers made 27 thousand, which is by 11 thousand more than in II quarter 2009. The largest share of such workers was recorded in manufacturing and agriculture (8 thousand in each), as well as in construction, trade and other sectors.
In III quarter 2009, the employment rate stood at 60.4%; over a quarter, it grew by 0.1 percentage points, while a year ago it was higher by 4.6 percentage points. In III quarter 2009, the male employment rate stood at 59.6, the female one – at 61.2%. Over a year, the male employment rate dropped by 7.9, the female one – by 1.5 percentage points.
CHANGES IN THE UNEMPLOYMENT RATE IN THE BALTIC STATES IN 2008–2009 BY QUARTER
According to the data of NSIs of the Baltic States, in III quarter 2009, the lowest unemployment rate was recorded in Lithuania (13.8%), the highest – in Latvia (18.4%); in Estonia, it stood at 14.6%. Over a quarter, the unemployment rate in Lithuania remained almost unchanged, while in Latvia and Estonia grew by 1.7 and 1.1 percentage points respectively.
|
|
Lithuania |
Latvia |
Estonia |
|
2008 |
|
|
|
|
I quarter |
4.9 |
6.5 |
4.2 |
|
II quarter |
4.5 |
6.3 |
4.0 |
|
III quarter |
5.9 |
7.2 |
6.2 |
|
IV quarter |
7.9 |
9.9 |
7.6 |
|
2009 |
|
|
|
|
I quarter |
11.9 |
13.9 |
11.4 |
|
II quarter |
13.6 |
16.7 |
13.5 |
|
III quarter |
13.8 |
18.4 |
14.6 |
Over III quarter 2009, 14.5 thousand persons, or 0.5% of the population aged 15 and over, were interviewed.
A press release on changes in the unemployment rate in IV quarter 2009 is due on 23 February 2010.
Annexes
Table 1. Unemployment rate, %
|
|
III quarter 2008 |
2009 |
Growth rate, III quarter 2009, against III quarter 2008, times |
Growth, drop (-), III quarter 2009, against II quarter 2009, percentage points | ||
|
I quarter |
II quarter |
III quarter | ||||
|
Total |
5.9 |
11.9 |
13.6 |
13.8 |
2.3 t. |
0.2 |
|
Youth (aged 15–24) |
15.0 |
25.0 |
29.6 |
33.3 |
2.2 t. |
3.7 |
|
Male |
6.0 |
14.6 |
16.7 |
17.3 |
2.9 t. |
0.6 |
|
Female |
5.9 |
9.2 |
10.4 |
10.3 |
1.7 t. |
-0.1 |
Table 2. The unemployed
|
|
III quarter 2008 |
2009 |
Growth, drop (-), III quarter 2009, against III quarter 2008 |
Growth, drop (-), III quarter 2009, against II quarter 2009 | ||||
|
I quarter |
II quarter |
III quarter | ||||||
|
thousand |
thousand |
% |
thousand |
% | ||||
|
Total |
97.2 |
193.9 |
223.1 |
228.1 |
130.9 |
2.3 t. |
5.0 |
2.2 |
|
Youth (aged 15–24) |
26.4 |
39.9 |
48.5 |
53.2 |
26.8 |
2.0 t. |
4.7 |
9.7 |
|
Male |
49.5 |
119.0 |
137.5 |
143.2 |
93.7 |
2.9 t. |
5.7 |
4.1 |
|
Female |
47.7 |
74.9 |
85.6 |
84.8 |
37.1 |
1.8 t. |
-0.8 |
-0.9 |
Table 3. Educational attainment of the unemployed aged 15–24
|
|
III quarter 2008 |
2009 |
Growth, drop (-), III quarter 2009, against III quarter 2008 |
Growth, drop (-), III quarter 2009, against II quarter 2009 | ||
|
I quarter |
II quarter |
III quarter | ||||
|
thousand |
% | |||||
|
Total |
26.4 |
39.9 |
48.5 |
53.2 |
2.0 t. |
9.7 |
|
Higher |
7.4 |
2.8 |
4.0 |
7.8 |
5.4 |
1.9 t. |
|
Secondary |
12.0 |
24.7 |
31.6 |
32.2 |
2.7 t. |
1.9 |
|
Basic |
7.1 |
12.3 |
12.9 |
13.3 |
1.9 t. |
3.1 |
Table 4. The unemployed by duration of unemployment
|
|
III quarter 2008 |
2009 |
Growth, drop (-), III quarter 2009, against III quarter 2008 |
Growth, drop (-), III quarter 2009, against II quarter 2009 | ||||
|
I quarter |
II quarter |
III quarter | ||||||
|
thousand |
thousand |
% |
thousand |
% | ||||
|
Total |
97.2 |
193.9 |
223.1 |
228.1 |
130.9 |
2.3 t. |
5.0 |
2.2 |
|
Under 1 month |
28.5 |
42.1 |
47.1 |
42.6 |
14.1 |
1.5 t. |
-4.5 |
-9.6 |
|
1–2 months |
11.3 |
23.2 |
18.8 |
20.6 |
9.3 |
1.8 t. |
1.8 |
9.6 |
|
3–5 months |
22.6 |
55.4 |
60.5 |
49.5 |
26.9 |
2.2 t. |
-11.0 |
-18.2 |
|
6–11 months |
13.4 |
35.0 |
50.6 |
62.6 |
49.2 |
4.7 t. |
12.0 |
23.7 |
|
1 year and more |
21.4 |
38.1 |
46.0 |
52.9 |
31.5 |
2.5 t. |
6.9 |
15.0 |
Table 5. Employment
|
|
III quarter 2008 |
2009 |
Growth, drop (-), III quarter 2009, against III quarter 2008 |
Growth, drop (-), III quarter 2009, against II quarter 2009 | ||||
|
I quarter |
II quarter |
III quarter | ||||||
|
thousand |
thousand |
% |
thousand |
% | ||||
|
Employed persons |
1537.6 |
1433.1 |
1422.3 |
1424.2 |
-113.4 |
-7.4 |
1.9 |
0.1 |
|
Unemployed persons |
97.2 |
193.9 |
223.1 |
228.1 |
130.9 |
2.3 t. |
5.0 |
2.2 |
|
Labour force |
1634.8 |
1627.0 |
1645.4 |
1652.3 |
17.5 |
1.1 |
6.9 |
0.4 |
Table 6. Employment and activity rates
|
|
III quarter 2008 |
2009 |
Growth, drop (-), III quarter 2009, against III quarter 2008 |
Growth, drop (-), III quarter 2009, against II quarter 2009 | ||
|
I quarter |
II quarter |
III quarter | ||||
|
% |
percentage points | |||||
|
Employment rate of the population aged 15–64 |
65.0 |
61.0 |
60.3 |
60.4 |
-4.6 |
0.1 |
|
Male employment rate |
67.5 |
61.0 |
60.3 |
59.6 |
-7.9 |
-0.7 |
|
Female employment rate |
62.7 |
60.9 |
60.4 |
61.2 |
-1.5 |
0.8 |
|
Employment rate of the elderly (aged 55–64) |
53.7 |
52.9 |
52.7 |
51.1 |
-2.6 |
-1.6 |
|
Activity rate of the population aged 15–64 |
69.2 |
69.3 |
70.0 |
70.3 |
1.1 |
0.3 |


 «The Baltic Course» Is Sold and Stays in Business!