Analytics, GDP, Lithuania
International Internet Magazine. Baltic States news & analytics
Saturday, 22.02.2025, 23:04
In 2009 GDP decreased by 15% in Lithuania
 Print version
 |
|---|
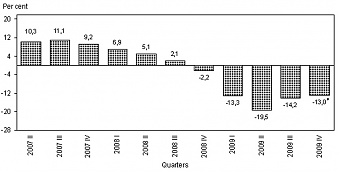
| Figure 1. Changes in GDP, as compared to the corresponding period of the previous year. ♦ GDP first estimate. |
In 2009, an inconsiderable increase of the value added was observed only in agriculture, forestry and fishery (1.6 per cent). The largest decrease of the value added was recorded in construction (43.3 per cent), trade, transport and communication services (17.3 per cent), industry and energy (14.4 per cent) sectors. A slower decrease in the value added was observed in public administration and defence, education, health care and social work (1.8 per cent).
In IV quarter 2009, GDP made LTL 23898.3 million at current prices, which is by 13 per cent less than in IV quarter 2008.
In 2009, per capita GDP at current prices made LTL 27685, in IV quarter 2009 – LTL 7156.
In IV quarter 2009, against IV quarter 2008, seasonally and working day adjusted, GDP decreased by 13 per cent, while against III quarter of the same year it increased by 0.1 per cent.
Revised Q3 2009 GDP
Statistics Lithuania, based on more detailed quarterly data and having estimated the value added by a more detailed list of economic activities, revised the second GDP estimate for III quarter 2009. According to the revised data, GDP in III quarter 2009 at current prices made LTL 23799.3 million and, as compared with III quarter 2008, decreased by 14.2 per cent (the previously released second GDP estimate equalled LTL 23953.7 million, and its drop rate made up 14.2 per cent).
Revised data are published on the website of Statistics Lithuania, in pre-defined tables and the Database of Indicators.
|
Changes in GDP | |||||||
|
|
At current prices |
Chain-linked volume | |||||
|
LTL million |
EUR million |
LTL million |
Changes, per cent |
Changes, seasonally and working day adjusted, per cent | |||
|
as compared to the previous period |
as compared to the corresponding period of the previous year |
as compared to the previous period |
as compared to the corresponding period of the previous year | ||||
|
2005 |
72060.4 |
20870.1 |
66558.6 |
7.8 |
7.8 |
7.8 |
7.8 |
|
I |
15057.7 |
4361.0 |
14784.9 |
-9.1 |
5.6 |
1.9 |
6.6 |
|
II |
17736.0 |
5136.7 |
16214.2 |
9.7 |
7.3 |
2.1 |
7.3 |
|
III |
19145.6 |
5545.0 |
17831.3 |
10.0 |
9.0 |
2.4 |
8.6 |
|
IV |
20121.1 |
5827.5 |
17728.1 |
-0.6 |
9.0 |
2.0 |
8.7 |
|
2006 |
82792.8 |
23978.5 |
71779.9 |
7.8 |
7.8 |
7.8 |
7.8 |
|
I |
17335.3 |
5020.6 |
15969.6 |
-9.9 |
8.0 |
1.6 |
8.4 |
|
II |
20250.7 |
5865.0 |
17625.9 |
10.4 |
8.7 |
1.7 |
7.9 |
|
III |
22205.9 |
6431.3 |
19124.8 |
8.5 |
7.3 |
1.8 |
7.3 |
|
IV |
23000.9 |
6661.5 |
19059.6 |
-0.3 |
7.5 |
2.5 |
7.8 |
|
2007 |
98669.1 |
28576.6 |
78842.9 |
9.8 |
9.8 |
9.8 |
9.8 |
|
I |
20468.8 |
5928.2 |
17329.1 |
-9.1 |
8.5 |
2.8 |
9.0 |
|
II |
24338.6 |
7049.0 |
19448.3 |
12.2 |
10.3 |
2.7 |
10.1 |
|
III |
26625.6 |
7711.3 |
21246.6 |
9.2 |
11.1 |
2.3 |
10.6 |
|
IV |
27236.1 |
7888.1 |
20818.9 |
-2.0 |
9.2 |
1.6 |
9.7 |
|
2008◘ |
111189.8 |
32202.8 |
81020.1 |
2.8 |
2.8 |
2.8 |
2.8 |
|
I |
24636.2 |
7135.1 |
18522.5 |
-11.0 |
6.9 |
0.5 |
7.3 |
|
II |
28697.8 |
8311.5 |
20438.1 |
10.3 |
5.1 |
-0.1 |
4.4 |
|
III |
29478.5 |
8537.6 |
21697.8 |
6.2 |
2.1 |
-0.7 |
1.3 |
|
IV |
28377.4 |
8218.7 |
20361.7 |
-6.2 |
-2.2 |
-1.2 |
-1.5 |
|
2009* |
92450.2 |
26775.4 |
68845.2 |
-15.0 |
-15.0 |
-15.0 |
-15.0 |
|
I |
20882.1 |
6047.9 |
16066.5 |
-21.1 |
-13.3 |
-11.4 |
-13.1 |
|
II |
23870.5 |
6913.4 |
16461.0 |
2.5 |
-19.5 |
-7.7 |
-19.8 |
|
III |
23799.3 |
6892.7 |
18612.7 |
13.1 |
-14.2 |
6.1 |
-14.3 |
|
IV |
23898.3 |
6921.4 |
17705.0 |
-4.9 |
-13.0 |
0.1 |
-13.0 |
 |
|---|
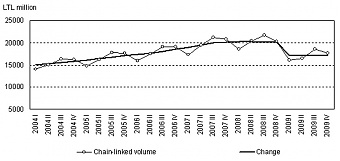
| Figure 2. Changes in GDP. |
More information is available on the website of Statistics Lithuania, in Pre-defined tables and in the Database of Indicators.


 «The Baltic Course» Is Sold and Stays in Business!

