
Analytics, Financial Services, Latvia
International Internet Magazine. Baltic States news & analytics
Saturday, 04.07.2026, 10:51
In 2007 household consumption expenditure in Latvia increased by 29%
 Print version
In 2007 household consumption expenditure on average per household member monthly reached LVL 200, an increase of 29% if compared to 2006 and 56% more than in 2005. The expenditure has grown due to both increase of economic resources of households and raise of credit obligation volume.
If compared to 2006 more rapid consumption expenditure growth was recorded in rural areas – 34%, but the lowest in Riga – 21%.
Household consumption expenditure (total in money and in kind) in 2006 and 2007 (average per household member monthly, LVL)
|
|
All households |
Urban areas |
Riga |
Rural areas |
|
2006 |
155 |
172 |
201 |
119 |
|
2007 |
200 |
219 |
243 |
161 |
|
2007/2006 (%) |
129 |
127 |
121 |
134 |
Consumption expenditure still is higher in urban households, where it reached LVL 219 per household member monthly (in Riga households – LVL 243). Consumption expenditure in rural households was noticeably lower – LVL 161 per household member monthly.
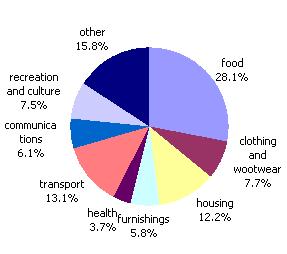
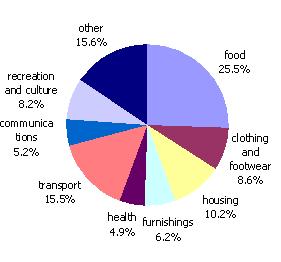
Main priority of the household consumption expenditure was food, and it is one of the internationally comparable material welfare indicators. In 2007 on average 25% of all consumption expenditure households spent on food. The share of this expenditure has a trend to reduce year by year. But, if compared to previous year, the actual expenditure on food has grown from LVL 44 to LVL 51 on average per household member monthly. When examining the Baltic States it should be noted that, in 2007 in Lithuania the food expenses constituted 33% of household’s consumption expenditure, but in Estonia – 25%.
Considerable share in consumption expenditure had expenses on transport (16%) and on housing2 (10%). Generally on average in all households such main expenses as costs on food, housing and public utilities, transport, clothing and footwear, and health constituted almost two thirds (65%) of total consumption expenditure. Compared to 2006 this expenditure has grown by 29%.
 |
|
Structure of household consumption expenditure (in %), 2006 |
 |
|
Structure of household consumption expenditure (in %), 2007 |
In 2007 consumption expenditure on health witnessed the most rapid growth – increase of 70%, of which expenses on pharmaceutical goods grew by 64%, but on dental care even 2.6 times. Expenses on transport increased rapidly – by 53%, more has been spent also on clothing and footwear – growth of 44%.
As expenses on recreation and culture and on furnishings has grown (by 42% and 39%, respectively), it may be concluded that, in 2007 households were able to spend more on things not related to basic needs. Consumption expenditure on communications witnessed rather modest growth – by 9.2%, as well as, did expenditure on housing, water, electricity, gas and other fuels – by 7.9% (information has been compiled on payments actually made).
According to the survey data the highest rate of the consumption expenditure was in households of Riga (LVL 243 per household member monthly) and of Pieriga region (LVL 217). In other regions the consumption expenditure per household member was lower. Last year the smallest consumption expenditure growth (by 24%) was recorded in Vidzeme, but the lowest consumption expenditure was in Latgale, where it did not reach LVL 160 per household member monthly. When examining consumption expenditure within socio-economic groups, it may be concluded that, comparatively better situation was observed in households of self-employed, where consumption expenditure reached LVL 226 (on average per household member monthly), as well as, in households of wage and salary earners, where it was LVL 211.
 |
| Structure of consumption expenditure by socio-economic groups (in LVL) |
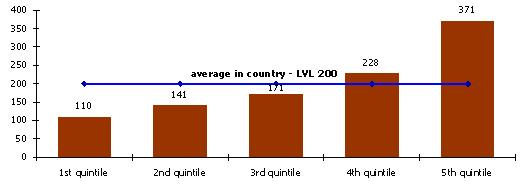
Quintile groups3 are used to characterize the consumption expenditure in households of different levels. One fifth or 20% of all households is represented in each of them. In 20% of the poorest households (1st quintile) the average consumption expenditure constituted 110 LVL per household member monthly. These households spent 35% on food, but on housing – 13% of their consumption expenditure. The consumption expenditure of 1st quintile households reached 55% of average household consumption expenditure level in the country. 22% of the total country population living in households lives in 20% of the poorest households. Almost one third (31%) of the total number of children living in households lives in households of the 1st quintile. In 2007 more rapid increase of consumption expenditure was recorded in households of 3rd and 4th quintile groups (if compared to 2006, by 30% and 35%, respectively) In the poorest (1st) quintile group it was lower and the increase constituted 22%. But the consumption expenditure of 20% of the richest households (5th quintile) was LVL 371 per household member monthly; and that is 1.9 times above the average indicators.
 |
|
Consumption expenditure by quintile groups (average per household member monthly, LVL) |
1 A household is a person or a group of persons tied by relationship or other personal relation, who live together in the same dwelling and share expenditures.
2 Expenditures on housing: rent, payments for water, gas, fuel or other utility payments.
3 Quintile groups are formed by arranging all households in ascending sequence by income per one household member and dividing them afterwards in five equal groups.
Household consumption expenditure (total in money and in kind) (average per household member monthly)
|
|
All households |
Urban areas |
Rural areas | |||
|
2007, LVL |
2007 over 2006,% |
2007, LVL |
2007 over 2006,% |
2007, LVL |
2007 over 2006,% | |
|
Consumption expenditure |
200.3 |
129 |
218.9 |
127 |
160.6 |
134 |
|
Food and non-alcoholic beverages |
51.0 |
117 |
52.5 |
117 |
47.7 |
116 |
|
Alcoholic beverages, tobacco |
6.0 |
119 |
6.1 |
116 |
5.7 |
125 |
|
Clothing and footwear |
17.3 |
144 |
19.4 |
139 |
12.9 |
165 |
|
Housing, water, electricity, gas and other fuels |
20.5 |
108 |
24.5 |
108 |
12.0 |
104 |
|
Furnishings, household equipment and routine maintenance of the house |
12.4 |
139 |
12.9 |
131 |
11.4 |
162 |
|
Health |
9.7 |
170 |
10.6 |
159 |
7.9 |
211 |
|
Transport |
31.1 |
153 |
32.9 |
155 |
27.1 |
150 |
|
Communications |
10.4 |
109 |
11.5 |
108 |
8.1 |
111 |
|
Recreation and culture |
16.4 |
142 |
18.6 |
135 |
11.7 |
169 |
|
Education |
2.5 |
114 |
3.1 |
117 |
1.2 |
98 |
|
Hotels, cafes and Restaurants |
11.7 |
128 |
13.8 |
125 |
7.3 |
139 |
|
Miscellaneous goods and services |
11.3 |
140 |
13.0 |
136 |
7.6 |
158 |


 «The Baltic Course» Is Sold and Stays in Business!