
Analytics, Industry, Latvia, Markets and Companies
International Internet Magazine. Baltic States news & analytics
Sunday, 23.02.2025, 09:50
In August prices for the total industrial production in Lithuania decreased by 1.1%
 Print version
The overall price change was mainly
influenced by a 2.9% decrease in prices for the production of the manufacture
of refined petroleum products, 1.3% – chemicals and chemical products, 0.7% –
food products, as well as by a 0.7% increase in prices for the production of
electricity, gas, steam and air conditioning supply, 1.6% – manufacture of
wearing apparel.
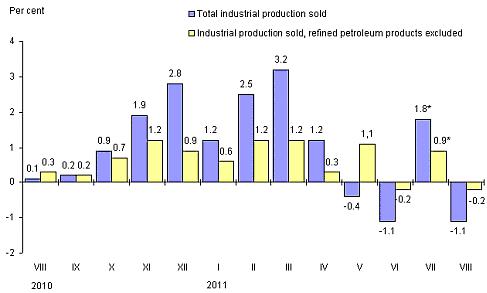 |
| Fig. 1. Changes in prices for industrial production sold over a month, compared to the previous month |
* Revised data.
Prices for products sold on the Lithuanian market over a month (in August 2011, against July) dropped by 0.5%. This price change was mostly determined by a decrease in prices for the production of the manufacture of refined petroleum products – by 2.5%, chemicals and chemical products – 3.7%, food products – 0.6%, as well as by an increase in prices for electricity, gas, steam and air conditioning supply production – by 0.7%, production of the manufacture of rubber and plastic products – 0.9%.
As regards the food products, the highest price drop was observed in prices for processed and preserved potatoes – by 13.6%, prepared feeds for farm animals – 3.7%, grain mill products – 3.1%, while prices for processed and preserved fruit and vegetables grew by 5.2%.
Over the month, prices for products sold on the non-Lithuanian market dropped by 1.5%. This was mostly influenced by a 3% decrease in prices for the production of the manufacture of refined petroleum products, 0.8% – chemicals and chemical products, as well as by a 2.8% increase in prices for wearing apparel, 1.6% – production of the manufacture of computer, electronic and optical products.
Over the year (August 2011,
compared to August 2010), prices for total industrial production sold grew by
13.9%. The greatest price rise was observed in prices for the extraction of
crude petroleum – by 38.5%, production of the manufacture of chemicals and
chemical products – 30.4%, production of the manufacture of refined petroleum
products – 29.2%, while prices for the production of the manufacture of
computer, electronic and optical products dropped by 8.5%, printing and
reproduction of recorded media – 2.8%, production of the manufacture of motor
vehicles, trailers and semi-trailers – 2.5%.
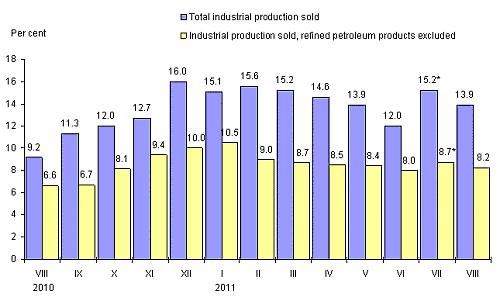 |
| Fig. 2. Changes in prices for industrial production sold over a year, compared to the corresponding month of the previous year |
* Revised data.
Prices for products sold on the Lithuanian market over a year increased by 10.5%. The most remarkable price rise was observed in prices for the production of the manufacture of refined petroleum products – by 29.4%, extraction of crude petroleum – 29.1%, production of the manufacture of chemicals and chemical products – 19.1%, while prices for waste collection, treatment and disposal activities; materials recovery products dropped by 5.7%, production of the manufacture of machinery and equipment n.e.c. – by 3.7%.
Prices for products sold on the non-Lithuanian market over a year grew by 17.2%. The greatest price rise was observed in prices for the extraction of crude petroleum – 43.6%, production of the manufacture of chemicals and chemical products – 34%, refined petroleum products – 29.3%, while prices for the production of the manufacture of computer, electronic and optical products went down by 11.5%, production of the manufacture of motor vehicles, trailers and semi-trailers – 3.5%.
Table 1. Changes in prices for industrial production sold, August 2011, %
|
Economic activity
|
Relative share in industrial production |
Growth, drop (-) August 2011, against |
||
|
July 2011 |
2010 |
|||
|
December |
August |
|||
|
Total industrial production sold |
100.0 |
-1.1 |
7.5 |
13.9 |
|
Mining and quarrying |
0.8 |
0.5 |
9.4 |
18.3 |
|
Manufacturing |
83.3 |
-1.4 |
7.1 |
14.9 |
|
Manufacture of refined petroleum products |
29.8 |
-2.9 |
13.3 |
29.2 |
|
Electricity, gas, steam and air conditioning supply |
14.8 |
0.7 |
9.8 |
8.8 |
|
Water supply; sewerage, waste management and remediation activities |
1.1 |
1.3 |
4.2 |
2.9 |
|
|
|
|
|
|
|
Total industrial production, refined petroleum products excluded |
70.2 |
-0.2 |
5.0 |
8.2 |
|
Manufacturing production, refined petroleum products excluded |
53.5 |
-0.5 |
3.7 |
7.8 |
|
|
|
|
|
|
|
Total industrial production sold on the Lithuanian market |
100.0 |
-0.5 |
7.9 |
10.5 |
|
Mining and quarrying |
0.9 |
1.0 |
7.4 |
12.6 |
|
Manufacturing |
64.4 |
-1.1 |
7.1 |
11.4 |
|
Manufacture of refined petroleum products |
12.6 |
-2.5 |
15.3 |
29.4 |
|
Electricity, gas, steam and air conditioning supply |
33.2 |
0.7 |
9.8 |
8.8 |
|
Water supply; sewerage, waste management and remediation activities |
1.5 |
0.1 |
2.3 |
-1.9 |
|
|
|
|
|
|
|
Total industrial production sold on the Lithuanian market, refined petroleum products excluded |
87.4 |
-0.1 |
6.9 |
7.9 |
|
Manufacturing production, refined petroleum products excluded |
51.8 |
-0.7 |
5.1 |
7.3 |
|
|
|
|
|
|
|
Total industrial production sold on the non-Lithuanian market |
100.0 |
-1.5 |
7.1 |
17.2 |
|
Mining and quarrying |
0.7 |
0.0 |
11.3 |
25.2 |
|
Manufacturing |
98.4 |
-1.6 |
7.1 |
17.3 |
|
Manufacture of refined petroleum products |
43.6 |
-3.0 |
12.8 |
29.3 |
|
Electricity, gas, steam and air conditioning supply |
- |
|
|
|
|
Water supply; sewerage, waste management and remediation activities |
0.9 |
2.9 |
6.8 |
7.6 |
|
|
|
|
|
|
|
Total industrial production sold on the non-Lithuanian market, refined petroleum products excluded |
56.4 |
-0.3 |
2.8 |
8.7 |
|
Manufacturing production, refined petroleum products excluded |
54.8 |
-0.4 |
2.6 |
8.6 |
- – The phenomenon (indicator) was not observed in the period in question.
Table 2. Industrial production whose influence on a monthly (August 2011, against July)
Change in prices for
industrial production sold was the greatest, by economic activity
Percentage points
|
NACE code |
Economic activity |
+ |
NACE code |
Economic activity |
- |
|
Total industrial production sold |
|||||
|
35 |
Electricity, gas, steam and air conditioning supply |
0.110 |
19 |
Manufacture of refined petroleum products |
-0.922 |
|
14 |
Manufacture of wearing apparel |
0.026 |
20 |
Manufacture of chemicals and chemical products |
-0.129 |
|
38 |
Waste collection, treatment and disposal activities; materials recovery |
0.015 |
10 |
Manufacture of food products |
-0.112 |
|
27 |
Manufacture of electrical equipment |
0.009 |
11 |
Manufacture of beverages |
-0.033 |
|
26 |
Manufacture of computer, electronic and optical products |
0.008 |
13 |
Manufacture of textiles |
-0.012 |
|
Industrial production sold on the Lithuanian market |
|||||
|
35 |
Electricity, gas, steam and air conditioning supply |
0.247 |
19 |
Manufacture of refined petroleum products |
-0.337 |
|
22 |
Manufacture of rubber and plastic products |
0.022 |
20 |
Manufacture of chemicals and chemical products |
-0.136 |
|
27 |
Manufacture of electrical equipment |
0.013 |
10 |
Manufacture of food products |
-0.125 |
|
29 |
Manufacture of motor vehicles, trailers and semi-trailers |
0.006 |
11 |
Manufacture of beverages |
-0.062 |
|
28 |
Manufacture of machinery and equipment n.e.c. |
0.006 |
31 |
Manufacture of furniture |
-0.028 |
|
Industrial production sold on the non-Lithuanian market |
|||||
|
14 |
Manufacture of wearing apparel |
0.067 |
19 |
Manufacture of refined petroleum products |
-1.389 |
|
26 |
Manufacture of computer, electronic and optical products |
0.025 |
20 |
Manufacture of chemicals and chemical products |
-0.123 |
|
38 |
Waste collection, treatment and disposal activities; materials recovery |
0.025 |
10 |
Manufacture of food products |
-0.102 |
|
24 |
Manufacture of base metals |
0.015 |
17 |
Manufacture of paper and paper products |
-0.023 |
|
31 |
Manufacture of furniture |
0.009 |
13 |
Manufacture of textiles |
-0.023 |


 «The Baltic Course» Is Sold and Stays in Business!