
Analytics, Education and Science, Latvia, Real Estate, Society, Statistics
International Internet Magazine. Baltic States news & analytics
Tuesday, 29.04.2025, 04:34
Census result: Latvia’s population comprised 2,067, 887 in 2011
 Print version
| Number of Latvia population (data of the Population and Housing Census, thsd persons) |
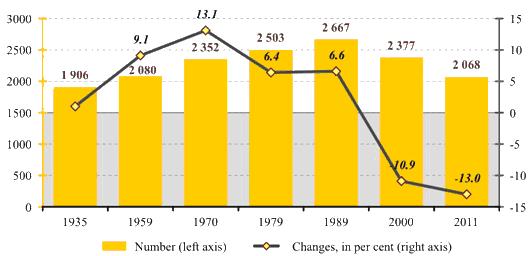 |
The reduction in the population number has been caused by both population natural movement (number of deaths exceeding the number of births) and international migration. As the number of deaths during the whole time period since the last Census has been higher than the number of births, the number of population due to this factor has diminished by 119 thousand, but because of the international migration – by 190 thousand persons.
Information of the Population and Housing Census characterising the number of population at the Census moment – March 1, 2001 – differ from the data on the situation at the beginning of 2011 calculated and published by the CSB prior. The difference in the numbers may be explained with the fact that large part of the population does not inform the governing bodies about the change of their place of residence, therefore the data on the residences of the Latvia nationals outside the country are not updated.
Within the framework of the running Population and Housing Census, in compliance with the requirement of the Regulation (EC) No 763/2008, the usual place of residence had to be indicated instead of the declared or registered one.
Provisional results of the Population and Housing Census show that the most notable reduction in the number of population, if compared to 2000, was recorded in Latgale (of 21.1%) and Vidzeme (of 17.5%). Whereas in Pieriga region the number has grown by 3.2%.
Among the cities under state jurisdiction the most significant drop of the population number during this time period was observed in the four largest cities: Daugavpils – decrease of 19.3%, Rēzekne – of 18.1%, Liepāja – of 14.6%, and Riga – of 14.2%. The population reduction rates below the country average level (13.2%), during the time period since 2000, were recorded in Ventspils (diminish of 12.1%), Jēkabpils (of 11.8%), Valmiera (of 9.7%), Jūrmala (of 8.9%), and in Jelgava (of 6.7%).
The smallest population numbers were recorded in Baltinava county (1,178 persons), Alsunga county (1,470) and Mērsrags county (1,638). Whereas the greatest in Ogre county (36,173), Talsi county (31,192), and Tukums county (30,602 persons).
Within the time period since the last Population and Housing Census the increase in the population number was observed in 16 counties. While in other 94 counties the number has reduced, moreover the largest reduction (of 25 – 33%) was detected in Aglona, Aloja, Alsunga, Baltniava, Cibla, Dagda, Ērgļi, Jēkabpils, Kārsava, Nereta, Rigāji, Rundāle, Tērvete, and Viļaka counties.
Provisional results of the Population and Housing Census 2011 show that 946.8 thousand persons of the Latvia population are males and 1,121.1 thousand are females. The share of men in the total number of population has reduced from 46.1% in 2000 to 45.8% in 2011, but the share of women has slightly increased – from 53.9% to 54.2%. In Latvia the number of women exceeds the number of men by 174 thousand, but during the Population and Housing Census 2000 this difference comprised 187 thousand.
The lowest share of men in the total number of population among the 110 counties was recorded in Cēsis county – 44.9%, followed by Aizkraukle county – 45.1%, Saulkrasti county – 45.4%, and Varakļāni county – 45.4%, but the highest share of males was observed in Burtnieki county – 52.2%, Aknīste county – 50.6%, Nereta county – 49.9%, and Vecpiebalga county – 49.5%.
Population age-specific rates and their changes
Due to unfavourable demographic processes a faster aging of the population takes place – the number of children is reducing and the number of elderly people and their share in the total population is growing.
Main
population age groups in 2000 and 2011
|
|
Number of population |
Share in % |
||
|
2000 |
2011 |
2000 |
2011 |
|
|
All population |
2377383 |
2067887 |
100 |
100 |
|
Of which aged: |
|
|
|
|
|
under working age (0 – 14) |
430275 |
291744 |
18.1 |
14.1 |
|
of working age (15 – 61) |
1511322 |
1326019 |
63.6 |
64.1 |
|
above working age (62+) |
435786 |
450124 |
18.3 |
21.8 |
During the time period between the two Censuses the total number of population in the country, as mentioned prior, has reduced by 309 thousand or 13.0%, of which the decrease among the population aged 0 – 14 years comprised 138 thousand or 32.2% of the total number of persons at this age, but within the group of persons of working age (15 – 61) the number constituted 185 thousand or 12.3%. The number of children (0 – 14) has reduced noticeably in Vidzeme region – by 44.1%, in Latgale region – by 41.7%, in Kurzeme region – by 36.2% and in Zemgale region – by 35.9%.
Meanwhile the
number of persons at retirement age has grown by 14 thousand or 3.3%.
In comparison with 2000, the most notable growth in the number of persons at retirement age (of 24.9%) was recorded in Pieriga region, while Riga and Latgale, if compared to the previous Census, now are resided by a smaller number of persons at retirement age.
Population ethnic composition and its changes
Information of the Population and Housing Census 2011 regarding the ethnic composition of the population has been obtained basing on the resident opinion.
Number of
persons in the largest ethnic groups and share of selected ethnicities in the
total number of population
|
|
2000 |
2011 |
2011 as % over 2000 |
||
|
number |
share in% |
number |
share in% |
||
|
All population |
2377383 |
100 |
2067887 |
100 |
87.0 |
|
Of which: |
|
|
|
|
|
|
Latvians |
1370703 |
57.7 |
1284194 |
62.1 |
93.7 |
|
Russians |
703243 |
29.6 |
556422 |
26.9 |
79.1 |
|
Belarusians |
97150 |
4.1 |
68174 |
3.3 |
70.2 |
|
Ukrainians |
63644 |
2.7 |
45699 |
2.2 |
71.8 |
|
Poles |
59505 |
2.5 |
44783 |
2.2 |
75.3 |
|
Lithuanians |
33430 |
1.4 |
24426 |
1.2 |
73.1 |
|
Romanies |
8205 |
0.3 |
6452 |
0.3 |
78.6 |
|
Jews |
10385 |
0.4 |
6416 |
0.3 |
61.8 |
|
Germans |
3465 |
0.1 |
3023 |
0.1 |
87.2 |
|
Estonians |
2652 |
0.1 |
2000 |
0.1 |
75.4 |
|
other |
25001 |
1.1 |
26298 |
1.3 |
105.2 |
The information presented in the table show that during the time period since the last Population and Housing Census the absolute number of persons of all largest ethnic groups has diminished. But the share of Latvians – main ethnicity – in the total number of population in the country as a whole has increased from 57.7% in 2000 to 62.1% currently. The share of Russian residents has reduced from 29.6% in 2000 to 26.9% in 2011, share of Belarusians – from 4.1% to 3.3%, of Ukrainians – from 2.7% to 2.2%, of Poles – from 2.5% to 2.2%, and of Lithuanians – from 1.4% to 1.2%.
Data of the Population and Housing Census 2011 show that Latvia is resided by persons of more than 170 various nationalities.
Population citizenship
Provisional results of the Population and Hosing Census show that along with the reduction in the total number of Latvia population also the number of Latvia citizens, non-citizens and citizens of other countries is decreasing. Nevertheless the relative indicators show that the proportion of Latvia citizens in the total number of the country population during the time period since the last Population and Housing Census has risen from 74.5% to 83.8%.
Population
citizenship in 2000 and 2011
|
|
2000 |
2011 |
||
|
number |
share in% |
number |
share in% |
|
|
All population |
2377383 |
100 |
2067887 |
100 |
|
citizens of Latvia |
1770210 |
74.5 |
1732880 |
83.8 |
|
non-citizens of Latvia |
503999 |
21.2 |
290660 |
14.1 |
|
citizens of other countries |
103174 |
4.3 |
44347 |
2.1 |
|
citizens of the EU Member States |
703 |
0.0 |
5730 |
0.3 |
|
citizens of other countries, not
EU Member States |
102471 |
4.3 |
38617 |
1.9 |
As the number of
the EU Member States is growing, the number of citizens of the EU counties
since the previous Population and Housing Census has increased noticeably. Also
the number of citizens of Russia, Ukraine and Belarus has risen. The number of
citizens of other countries currently is noticeably smaller than during the
previous Population and Housing Census, because in 2000 75.6 thousand persons
indicated that they are citizens of the former Soviet Union.
Population labour status
Within the framework of the Population and Housing Census 2011 the information on the labour status of all population, including persons aged 15 and over, was obtained. Provisional results of the Population and Housing Census show that 57.5% of the persons at mentioned age are active, and the share of employed persons in this number comprises 47.3%.
Analysis of the Population and Housing Census data on labour status of the population aged 15 – 74 show that 63.3% of the population at this age were active, of which 52.1% are employed persons. The unemployment rate in the active population constitutes 17.7%.
The compiled data
indicate that inactive population accounts for 42.5%. Among it 26.6% were
unemployed pensioners, 7.8% were unemployed pupils and students and 8.1% –
persons having other labour status.
52.1% of the
unemployed persons were women and 47.9% – men. Nevertheless the activity rate
is higher among men (63.2%), if compared to 52.8% among women. The difference
in numbers may be explained with the analysis of the number of unemployed male
and female pensioners. There are 1.9 times more unemployed female pensioners.
Educational attainment of the population
In comparison with the Population and Housing Census 2000 information, the share of persons having higher education (including doctorate) in the total population aged 15 and over has increased from 13.9% to 23.0%, the share of persons having vocational secondary education – from 20.2% to 29.4%, meanwhile the share of persons having general secondary education has decreased from 31.0% to 22.9%, as has the share of persons having basic education – from 26.5% to 18.0%, and the share of persons having primary or lower education – from 8.4% to 6.7%.
Educational
attainment of the population
|
Highest level of education successfully completed |
Total population |
Share in total population, % |
|
All population aged 15 and over |
1776143 |
100 |
|
Doctorate |
6657 |
0.4 |
|
Higher education |
401323 |
22.6 |
|
Professional secondary and
vocational secondary education |
521629 |
29.4 |
|
General secondary education after
basic or vocational education |
407534 |
22.9 |
|
Basic education or professional
basic education |
318925 |
18.0 |
|
Primary education |
62645 |
3.5 |
|
Without formal education, less
than primary education or not indicated |
57430 |
3.2 |
Whereas the
breakdown of the data on population educational attainment by genders indicates
that 64.1% of the persons having earned doctorate are women and 35.9% – men.
Gender differences in data on other education levels are not so explicit.
Key indicators characterising population housing
In compliance with the requirements of the Regulation (EC) No 763/2008, within the framework of the Population and Housing Census 2011, unlike in the previous Censuses, along with the population also its housings were surveyed. It means that information was obtained not only on dwellings having permanent residents, but also on dwellings without permanent residents and dwellings residents of which are not included in the Census (foreign military, sea force and consular personnel and their family members residing the country, foreign civilians working in the country for an indefinite period; other groups of persons residing the country for an indefinite period, e.g., tourists).
The provisional results of the Population and Housing Census 2011 show that in
the country there are 1,023 thousand dwellings suitable for occupation. Of
which 812 thousand dwellings (79.4% of the total number) are resided by
permanent residents, 210 thousand dwellings (20.5%) at the Census moment (March
1, 2011) were without permanent residents and 1 thousand (0.1%) were dwellings
residents of which are not included in the Census.
One third of all occupied dwellings (33.5%) were located in Riga, 16.4% – in Pieriga region, 15.4% – in Latgale region, 13.2% – in Kurzeme region, 11.8% – in Zemgale region and 9.7% – in Vidzeme region.
The lowest share
of dwellings without permanent residents was recorded in Riga (16.7%), whereas
the highest share in Pieriga region – 25.9% and in Latgale – 22.3%.
Within the framework of the Population and Housing Census the information on the construction year of the conventional dwellings was obtained.
Conventional dwellings in compliance with the definition of the Regulation (EC) No 1201/2009 are structurally separate and independent premises at fixed locations which are designed for permanent human habitation and are, at the reference data, a) used as a residence, or b) vacant, or c) reserved for seasonal or secondary use.
The provisional data of the Population and Housing Census show that in Latvia totally there are 988 conventional dwellings. The most active construction period was the time from 1971 till 1980, then 204 thousand dwellings were erected, and from 1981 till 1900 – with 191.2 thousand dwellings constructed. The smallest number of new dwellings built was recorded from 2001 till 2005 – only 18.2 thousand. Nevertheless it is noteworthy that from 2006 till 2011 42.8 thousand new dwellings were commissioned, and it is 2.3 times more, if compared to the first five years of this century. The data of the Population and Housing Census regarding the dwellings constructed from 2001 till 2011 show greater number than the construction statistics data, because part of the population lives in dwellings under construction or buildings not officially commissioned.
The highest share of buildings constructed until 1945 was observed in Vidzeme region – 32.6%, in Kurzeme region – 23.8% and in Riga – 20.9%. According to the Census information, the highest number of new dwellings built during the last decade was recorded in Pieriga region – 15.5% and in Riga – 6.7%, but the smallest number (1.6%) – in Latgale region.
The Census data
show that the highest share in the dwelling structure (680 thousand or 68.8%)
is formed by the dwellings in the apartment houses, second largest group (285
thousand or 28.9%) – by the individual houses. While the smallest share – 10
thousand or 1.0% – is comprised by semi-detached houses and 6.2 thousand or
0.6% – by row houses.
The proportion of dwellings in apartment houses above the average level in the country was observed in Riga, whereas the share of individual houses is noticeably higher outside Riga.
To compare with the neighbouring countries, in Latvia for the Population and Housing Census it was planned to spend the smallest amount per person – LVL 2.9, in Estonia – LVL 10.1, and in Lithuania – LVL 3.1. Moreover, the actual expenditure shows that in Latvia costs per resident are even lower – LVL 2.6. More information
on development and progress of the Population and Housing Census available on
the webpage http://www.csb.gov.lv/census |


 «The Baltic Course» Is Sold and Stays in Business!