
Analytics, Estonia, Industry, Markets and Companies
International Internet Magazine. Baltic States news & analytics
Wednesday, 30.04.2025, 19:18
Production of Estonian industrial enterprises remained on the same level in 2012
 Print version
A small growth in the production of manufacturing that took place at the beginning of 2012 compared to the same month of the previous year was replaced with a decline in March, which continued until the end of August. The main reason for the fall in production was the high reference base in the manufacture of electronic products, but also lower external demand had a negative impact. Since September the production in manufacturing grew significantly. The main reason for the growth at the end of the year was the recovery in the production volume in the manufacture of electronic products, in other branches of industry no significant changes occurred. Despite the faster output growth in industrial production at the end of the year, the summary of 2012 remained on the last year's level.
In the last months of 2012, the production in manufacturing grew mainly due to the increase in exports. More than 70% of the whole production of manufacturing was sold on the external market. Export sales of the manufacturing production grew 3% compared to 2011. The demand on the domestic market was lower – in 2012 domestic sales decreased by 2% compared to the previous year.
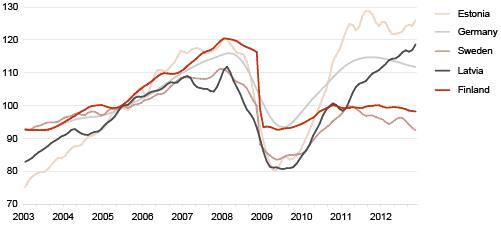 |
| Volume index trends of production in manufacturing in the European Union countries, January 2003 – November 2012 (2005 = 100) |
In 2012, the production exceeded the volume of the previous year in almost half branches. The growth in the production of manufacturing was positively influenced by the branches holding bigger shares – the manufacturing of electronic products where the production increased 4% compared to 2011 and the manufacturing of wood and food products where the production grew 1% in both branches. The growth in the production of manufacturing was negatively influenced by the fall in the manufacturing of metal products, chemicals, furniture and motor vehicles.
In December 2012, the production of industry increased 7% compared to December 2011; the production of manufacturing grew 6%. In December compared to December 2011, the production of electricity increased 5% and the production of heat 48%.
In December 2012 compared to November, the seasonally adjusted industrial production fell 1%; the production of manufacturing 2% during the month.
Change in volume index of industrial production, December 2012 and 2012 (percentages)
|
Economic activity |
2012 |
December 2012 |
||
|
change compared |
change compared to the |
|||
|
according to |
according to |
|||
|
TOTAL |
-0.4 |
-0.9 |
-1.0 |
6.7 |
|
Energy production |
-3.0 |
11.2 |
17.3 |
17.3 |
|
Mining |
-3.7 |
-11.2 |
-16.9 |
-16.9 |
|
Manufacturing |
0.1 |
-2.1 |
-2.5 |
5.6 |
|
manufacture of computer, electronic and optical products |
4.1 |
-8.1 |
67.7 |
81.4 |
|
manufacture of wood and wood products |
1.4 |
-2.3 |
-12.7 |
-6.2 |
|
manufacture of food products |
1.1 |
4.5 |
1.3 |
5.6 |
|
manufacture of fabricated metal products |
-13.9 |
-1.8 |
-26.0 |
-17.1 |
|
manufacture of electrical equipment |
5.6 |
-8.7 |
-25.0 |
-25.0 |
|
manufacture of chemicals and chemical products |
-1.5 |
4.0 |
5.9 |
16.1 |
|
manufacture of furniture |
-1.7 |
1.9 |
-13.7 |
-3.7 |
|
manufacture of motor vehicles |
-6.9 |
0.5 |
-8.4 |
-1.1 |
|
manufacture of building materials |
1.1 |
3.7 |
-4.5 |
4.3 |
|
manufacture of machinery and equipment |
4.5 |
-12.8 |
-21.7 |
-12.3 |
a In case of the seasonally adjusted
volume index, the impact of the differing numbers of working days in a month
and seasonally recurring factors has been eliminated. It is calculated only in
comparison with the previous period.
b In case of the
working-day adjusted volume index, the impact of the differing number of
working days in a month has been eliminated. It is calculated only in
comparison with the corresponding period of the previous year.


 «The Baltic Course» Is Sold and Stays in Business!