Analytics, EU – Baltic States, Financial Services, Good for Business, Latvia
International Internet Magazine. Baltic States news & analytics
Saturday, 31.01.2026, 13:57
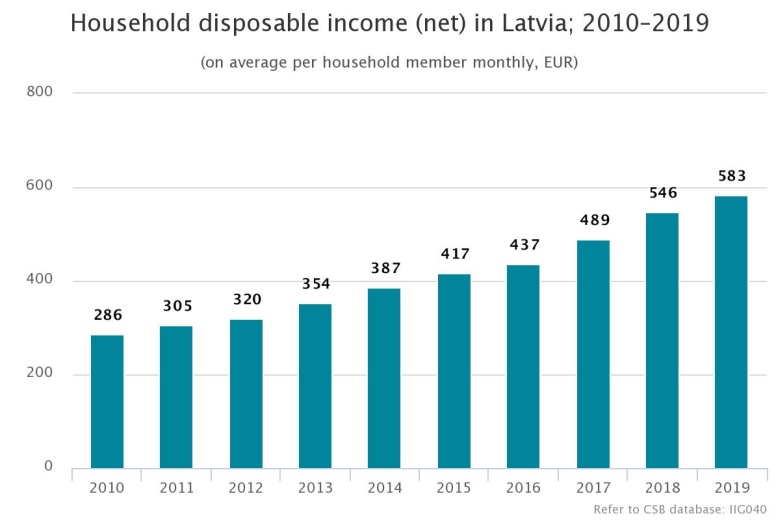
In 2019, household disposable income in Latvia increased by 6.8%
 Print version
Population income grew significantly slower than in previous years, when they rose by 11.7 % in 2018 and 11.8 % in 2017, respectively.
The highest income was in Riga, where they reached 690 EUR per one household member monthly. In Pierīga they reached 657 euros per household member a month, in Zemgale – 533 euros and in Kurzeme – 494 euros a month. The lowest income were in Vidzeme (479 euros monthly) and in Latgale (411 euros monthly). In urban areas income per one household member reached 614 euros monthly and in rural areas – 515 euros monthly.

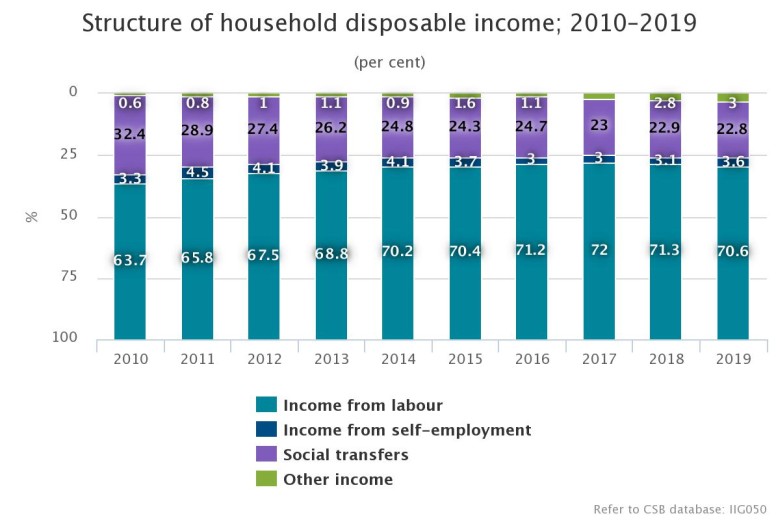
In 2019, household income from labour per household member rose by 5.8 % – from 389 euros a month in 2018 to 412 euros a month in 2019. However, income from social transfers2 (pensions, allowances and other budgetary payments) per household member grew by 6.3 % (from 125 euros a month to 133 euros a month).
The share of income from labour amounted to 70.6 % of the total disposable income and the share of social transfers amounted to 22.8 %.

In 2019 income per household member in the poorest households (1st quintile group) comprised 203 euros monthly, but in the richest households (5th quintile group) – 1 290 euros monthly. In households with average income they fluctuated from 353 euros monthly (2nd quintile group) to 680 euros monthly (4th quintile group).
Household disposable income by quintile group3; 2010–2019 (on average per household member monthly; EUR)
Quintile group | 2010 | 2011 | 2012 | 2013 | 2014 | 2015 | 2016 | 2017 | 2018 | 2019 | Income increase in 2019, compared to 2018, % |
1st (poorest households) | 97 | 105 | 112 | 125 | 135 | 150 | 154 | 162 | 186 | 203 | 9.5 |
2nd | 194 | 199 | 209 | 228 | 245 | 257 | 266 | 285 | 320 | 353 | 10.4 |
3rd | 257 | 260 | 272 | 295 | 317 | 340 | 360 | 401 | 444 | 483 | 8.8 |
4th | 338 | 352 | 372 | 413 | 449 | 483 | 514 | 572 | 638 | 680 | 6.5 |
5th (richest households) | 620 | 681 | 701 | 780 | 847 | 896 | 942 | 1076 | 1213 | 1290 | 6.4 |
National average | 286 | 305 | 320 | 354 | 387 | 417 | 437 | 489 | 546 | 583 | 6.8 |
As income of poorest (1st and 2nd quintile groups) households increased more rapidly, income inequality has slightly decreased. In 2019 income of richest population were 6.3 times higher than those of poorest population, which is 0.2 percentage points less than in 2018 when difference between this income was 6.5 times. Gini coefficient last year was 34.5 %, which is 0.7 percentage points less than in 2018 when it reached 35.2 %.
Income inequality indicators, 2010–2019
Indicator | 2013 | 2014 | 2015 | 2016 | 2017 | 2018 | 2019 |
Gini coefficient4 (%) | 35.5 | 35.4 | 34.5 | 34.5 | 35.6 | 35.2 | 34.5 |
Quintile share ration (S80/S20)5 | 6.5 | 6.5 | 6.2 | 6.3 | 6.8 | 6.5 | 6.3 |
Compared to other European Union (EU) Member States6, the income inequality level in Latvia still remains high. According to the latest data, the Gini coefficient of Latvia was the fourth highest among EU Member States. In 2018, the coefficient was higher only in Bulgaria (40.8 %), Lithuania (35.4 %) and Romania (34.8 %); the average coefficient of EU amounted to 30.7 %. Also quintile share ratio was the fourth highest in the EU. Higher quintile share ratio in 2018 was in Bulgaria (8.1), Romania (7.1) and Lithuania (6.4), while the EU average amounted to 5.1.
Household disposable income data source: survey on income and living conditions conducted by the CSB in 2020 (EU-SILC – EU Statistics on Income and Living Conditions), which was carried out from February 1 to August 24. Due to the emergency situation declared because of the spread of COVID-19, as of March 13 face-to-face interviews were terminated and surveys were carried out by telephone. The survey covered 6.1 thousand household and 11.1 thousand respondent aged 16 and over.
CSB will collect data on household disposable income in 2020 within the framework of the 2021 survey.
More information on the survey data is available in the CSB database section “Monetary poverty and income inequality indicators (EU-SILC survey)”.
Methodological explanations
1 Disposable (net) income is cash income from labour, employee income in kind received by using company car for private needs estimated in cash, income or losses received from self-employment, received pensions and benefits, regular material assistance from other households, profit from interests of deposits, dividends, shares, income received by children aged under 16, income from property rental, receipts from tax adjustments from the State Revenue Service (for business activities, eligible costs – education, medical treatment etc.).
2 Social transfers are pensions and benefits paid by the State or municipality, child maintenance payments, scholarships, social insurance benefits and compensations, including the ones paid by other countries.
3 A quintile group is one fifth (20 %) of the number of the surveyed households grouped in increasing sequence according to the disposable income per one household member. The bottom (first) quintile group includes one fifth of the households with the lowest income, while the top (fifth) quintile comprises one fifth of the households with the highest income level.
4 Gini coefficient characterises income inequality. It varies from 0 to 100. Gini coefficient amounts to 0 if there is absolute equality of income (i.e., all population has the same income), but the closer it gets to 100, the greater the inequality of income.
5 Quintile share ratio (S80/S20) is the ratio of total equivalised disposable income received by the 20 % of the country’s population with the highest equivalised disposable income (top quintile) to that received by the 20 % of the country’s population with the lowest equivalised disposable income (bottom quintile).
6 Eurostat indicators on the survey conducted in 2019 are available in the Eurostat database “Quintile share ratio”, “Gini coefficient”, while national data on the survey conducted in 2020 are available in the CSB database Social processes
- 28.01.2022 BONO aims at a billion!
- 26.08.2021 LLC Dizozols Investments finalizes investment attraction deal with Crowdestor with record-high profits
- 13.02.2021 Моя жизнь в газете. Очерки по новейшей истории Латвии. Глава 1
- 25.01.2021 Как банкиры 90-х делили «золотую милю» в Юрмале
- 30.12.2020 Накануне 25-летия Балтийский курс/The Baltic Course уходит с рынка деловых СМИ
- 30.12.2020 On the verge of its 25th anniversary, The Baltic Course leaves business media market
- 30.12.2020 Business Education Plus предлагает анонсы бизнес-обучений в январе-феврале 2021 года
- 30.12.2020 Hotels showing strong interest in providing self-isolation service
- 30.12.2020 EU to buy additional 100 mln doses of coronavirus vaccine
- 30.12.2020 ЕС закупит 100 млн. дополнительных доз вакцины Biontech и Pfizer


 «The Baltic Course» Is Sold and Stays in Business!

